

Quality of hire is the measure of how much value a new employee adds after they start, tracked through performance, retention and ramp speed rather than how fast or cheaply they were hired. The most reliable way to capture it is a composite score: normalise several post-hire indicators onto a common scale, then average them into one number per hire. A working scorecard turns that number into a diagnostic tool you can compare across recruiters, sources and roles.
TL;DR:
- Using a composite score to measure quality of hire helps normalize post-hire performance, retention, and ramp-up indicators for better comparison across roles and recruiters.
- Tracking both pre-hire signals and post-hire outcomes is essential to accurately predict performance and improve sourcing strategies, despite challenges in data ownership and timing.
- Regularly segmenting scores by source channel, recruiter, and manager enhances diagnostic insights and guides targeted improvements in hiring processes.
- Validating quality of hire scores against business KPIs like revenue or customer retention turns this metric into a meaningful indicator of ROI and hiring effectiveness.
- A fixed-fee recruitment service simplifies cost comparison and supports a reliable implementation of quality of hire scorecards without incentive distortions.
Table of Contents
- What is quality of hire and how do industry sources define it?
- Why is quality of hire hard to measure, and why measure it anyway?
- Pre-hire versus post-hire metrics: what to collect and why
- Quality of hire formula and a worked scorecard example
- Step-by-step: build and pilot a quality of hire scorecard
- Timing and cohort windows: when to measure and how to segment
- Tools and integration patterns that make QoH measurement feasible
- Benchmarks and how to interpret QoH scores
- Common pitfalls and fixes when measuring quality of hire
- Practitioner checklist and how The Recruitment Alternative supports better outcomes
- Bringing peer and subordinate feedback into quality of hire assessments
- Linking quality of hire metrics to business outcomes and ROI
- Best practices for communicating quality of hire results to leadership
- Case studies or real-world examples demonstrating impact of quality of hire measurement
- A recruiter’s take on what actually moves the needle
- How The Recruitment Alternative helps you put this into practice
- Sources
- FAQ
What is quality of hire and how do industry sources define it?
Ask five HR leaders to define quality of hire and you will get five slightly different answers, and that is not a failure of the concept. SHRM frames it as a metric organisations must build to their own strategic priorities rather than adopt as a fixed formula, because a sales-driven business cares about different outcomes than an engineering-heavy one. Crosschq goes further, calling quality of hire a “latent” construct: something you cannot observe directly, only infer from a cluster of related signals validated against real business results, as detailed in its analysis of the metric. AIHR’s practitioner guidance treats it similarly, as an outcome-based measure built from performance data, retention patterns and hiring manager feedback rather than a single survey question.
That distinction between latent and observable matters because it explains why quality of hire so often gets confused with efficiency metrics.
- Quality of hire — measures what happens after the offer is accepted: does this person perform, stay and ramp up as expected?
Efficiency and quality metrics are complementary, not competing. Recruiting teams need both, but only one of them tells you whether the hiring decision itself was good.
Why is quality of hire hard to measure, and why measure it anyway?
The hardest part of quality of hire is not deciding what to track. It is getting the data to sit in one place. Performance ratings live in the HRIS, retention data lives in payroll systems, and hiring manager satisfaction usually lives nowhere until someone builds a survey. Nobody in most organisations owns the full picture, because recruiting, people analytics and line managers each hold a piece.
- Fragmented ownership: recruiting owns the hire, but managers own the performance data.
- Attribution lag: you often cannot separate a poor hire from poor onboarding or a bad manager for months.
- Timing trade-offs: measure too early and you catch noise; measure too late and the business decision window has closed.
Despite those obstacles, the payoff justifies the effort. Organisations that track quality of hire consistently make sharper decisions about which sourcing channels to fund, which recruiters to coach, and which hiring managers need better interview training. It also protects retention: a hire who scores well on a composite quality of hire formula in month six is measurably less likely to churn in year one, which is the single most expensive failure mode in recruiting.
Pre-hire versus post-hire metrics: what to collect and why
Every quality of hire calculation blends two data families, and confusing them is the most common mistake in this space. Pre-hire metrics predict; post-hire metrics confirm.
- Pre-hire signals come from the recruitment process itself: assessment scores, candidates-per-hire ratios, referral rates and source yield (the proportion of applicants from a channel who become successful hires). These are available before day one and let you flag risk early.
- Post-hire outcomes come from the job itself: performance ratings at defined intervals, hiring manager satisfaction scores, ramp-to-productivity time, and 12-month retention. About half of organisations lean on hard performance indicators such as sales quotas, units produced or customer satisfaction scores as their core measure of new-hire performance, according to Workable’s quality of hire tutorial.
- The link between the two is where the real analytical value sits. If candidates who score above a set threshold on a structured assessment consistently land in the top half of post-hire performance ratings, that assessment is doing real predictive work, and you can lean on it more heavily in future shortlisting.
Tracking core recruitment metrics alongside these two families gives you the full funnel view: not just who you hired, but whether the process that produced them is actually working. Treat pre-hire data as your early warning system and post-hire data as your scorecard of record. Neither one alone tells the full story, but together they let you trace a bad outcome back to its cause: a weak source, a rushed interview, or a mismatch between the role and the candidate’s actual strengths.
Quality of hire formula and a worked scorecard example
The most widely used quality of hire formula is simpler than most HR teams expect. You normalise each indicator to a common 0 to 100 scale, then average them. The Intervue quality of hire calculator uses exactly this approach, combining performance score, ramp speed, hiring manager satisfaction and retention into a single composite figure.
Here is what that looks like with real numbers for a hypothetical account manager hired six months ago:
Average those four normalised scores and you get a composite quality of hire score of 88.5 out of 100, a strong result by most benchmarks.
A few notes on running this yourself:
- Weight indicators to reflect what matters most for the role. Ramp speed might carry more weight for a technical role than a relationship-driven one.
- Exclude involuntary layoffs and restructures from retention calculations. They distort the score and have nothing to do with hiring quality.
- Treat scores from very small cohorts (fewer than five hires) as directional only. One outlier skews the average badly at that scale.
Step-by-step: build and pilot a quality of hire scorecard
Building a scorecard from scratch feels daunting until you break it into a sequence. Here is the order that works.
- Run a stakeholder alignment session. Get recruiting, the hiring manager and a people analytics contact in one room and agree on what “a great hire” actually looks like for the role in question, in concrete, observable terms.
- Choose your indicators and set initial weights. Pick three to five measures, no more, and write down exactly how each one will be measured and when.
- Document definitions before you collect a single data point. Specify the date of measurement, the data source, and any exclusion rules (probation exits, internal transfers). Ambiguity here wrecks comparability later.
- Collect pilot data across one hiring cohort. Normalise every indicator to the same 0 to 100 scale and calculate the composite score for each hire.
- Validate against real business outcomes. Check whether high scorers are actually outperforming on the metrics the business cares about, revenue, output or customer satisfaction.
- Iterate the weights and embed the scorecard into regular reporting, ideally the same cadence as your existing recruiting metrics review.
Pro Tip: Standardise the hiring manager survey before you standardise anything else. Structured, consistent survey questions do more to improve scorecard reliability than any amount of statistical tweaking after the fact.
Timing and cohort windows: when to measure and how to segment
Measure too early and you are scoring onboarding, not hiring. Measure too late and the business has already moved past the decision the data was meant to inform. Most published guidance recommends a layered approach:
- 90 days: a first checkpoint, useful mainly for flagging early flight risk and initial ramp progress.
- 6 months: the point where performance data starts to mean something and hiring manager satisfaction stabilises.
- 12 months: the most reliable full-picture measure, once retention, sustained performance and ramp are all observable.
Measuring within this 90-day to 12-month window keeps outcomes attributable to the hiring and onboarding decisions you actually made, rather than to unrelated events much later in the employee’s tenure. Segment every score by recruiter, hiring manager, role type and source channel. A single blended average hides the fact that one recruiter’s hires are consistently outperforming another’s, or that one hiring manager’s interview panel needs coaching. That segmentation is where quality of hire metrics stop being a report and start being a diagnostic tool.
Tools and integration patterns that make QoH measurement feasible
Most applicant tracking systems were built to manage the hiring funnel, not to track what happens afterwards. Most ATS platforms do not natively hold post-hire outcome data, so HR teams typically need to connect it to their HRIS or build the join themselves in a reporting tool.
Three capabilities matter most:
- Data export from the ATS: candidate source, assessment scores and recruiter attribution need to leave the ATS in a usable format.
- HRIS linkage: performance ratings, tenure and exit reasons live here and need to be matched back to the original hiring record.
- A lightweight survey tool for hiring manager satisfaction, since almost no core HR system captures this well by default.
If your systems do not talk to each other, do not wait for a perfect integration before you start. A shared spreadsheet, a fixed monthly update cadence, and one named owner for pulling the data together will get you a usable scorecard long before an IT project delivers a technical fix.
Benchmarks and how to interpret QoH scores
Published composite quality of hire benchmarks sit around the mid-range out of 100, and the gap between sourcing channels is often the most useful number in the whole exercise.
Benchmark snapshot: Composite QoH scores average at a moderate level in published data, with hires sourced through internal mobility and employee referrals consistently scoring higher than those sourced from job boards, according to Taleva’s quality of hire benchmarking research.
Treat that number as a reference point, not a target to chase blindly. Absolute benchmarks vary by industry, seniority and how strictly an organisation defines its indicators, so a trend line for your own hires, quarter over quarter, tells you more than a single external comparison ever will. Use the benchmark to sense-check whether your scoring is realistic, then set improvement goals against your own historical cohort rather than against a published industry figure. If your job-board hires are scoring meaningfully below your referral hires, that gap is where your next sourcing investment should go.
Common pitfalls and fixes when measuring quality of hire
The three mistakes that undermine most quality of hire programs are all fixable with modest effort.
- Manager bias in performance ratings. Fix it with structured, calibrated survey questions rather than open-ended satisfaction ratings, so different managers are scoring against the same criteria.
- Small sample noise. A single bad hire in a cohort of three destroys the average. Aggregate scores across quarters or role families until the sample is large enough to mean something.
- No feedback loop. If recruiters and hiring managers never see the resulting scores, nobody adjusts behaviour. Share results back to the people who influence the next hire, not just to leadership.
Pro Tip: Run hiring manager surveys on a fixed schedule, not on an ad hoc basis. Consistent timing removes one entire source of scoring variance before you have collected a single data point.
Practitioner checklist and how The Recruitment Alternative supports better outcomes
A phased checklist keeps a quality of hire rollout from stalling after the first enthusiastic meeting.
- Day 30: agree indicators, weights and data sources with stakeholders; document definitions.
- Day 60: confirm data pipelines (ATS export, HRIS access, survey tool) are actually working.
- Day 90: run the first checkpoint scoring on your pilot cohort; flag early flight risk.
- Day 180: calculate full composite scores, validate against real performance and retention outcomes, and adjust weights.
A fixed-fee structure means the cost of a hire can be known upfront rather than tied to salary percentage. That predictability makes it easier for HR teams to run their own quality of hire tracking against a hiring cost that does not shift from role to role. Reviewing recruitment partners against a structured evaluation checklist is a useful exercise before committing to any external recruiting support.
Bringing peer and subordinate feedback into quality of hire assessments
Hiring manager satisfaction is the easiest post-hire signal to collect, and also the most limited. A single manager’s view misses how a new hire actually operates day to day: whether they collaborate well, whether direct reports trust their judgement, whether peers rely on their work.
Multi-rater feedback fixes that blind spot. Adding a short peer survey, three to five questions, asked at the same 90-day or 6-month checkpoint as the manager survey, gives you a second, independent data point to weigh against the manager’s rating. For hires who will eventually lead teams, subordinate feedback (once they have direct reports) becomes one of the most predictive signals available, since it captures leadership quality that a manager one level up often cannot see directly.
The practical challenge is keeping this lightweight. Full 360-degree reviews are heavy, slow and easy to abandon after one cycle. A workable compromise is a short, anonymous peer pulse survey run alongside the existing hiring manager satisfaction check, using the same rating scale so the results normalise into your composite score without extra calculation. Treat any single low peer score as a flag to investigate, not as an automatic mark against the hire. Context matters, and one disgruntled colleague should never sink an otherwise strong scorecard.
Linking quality of hire metrics to business outcomes and ROI
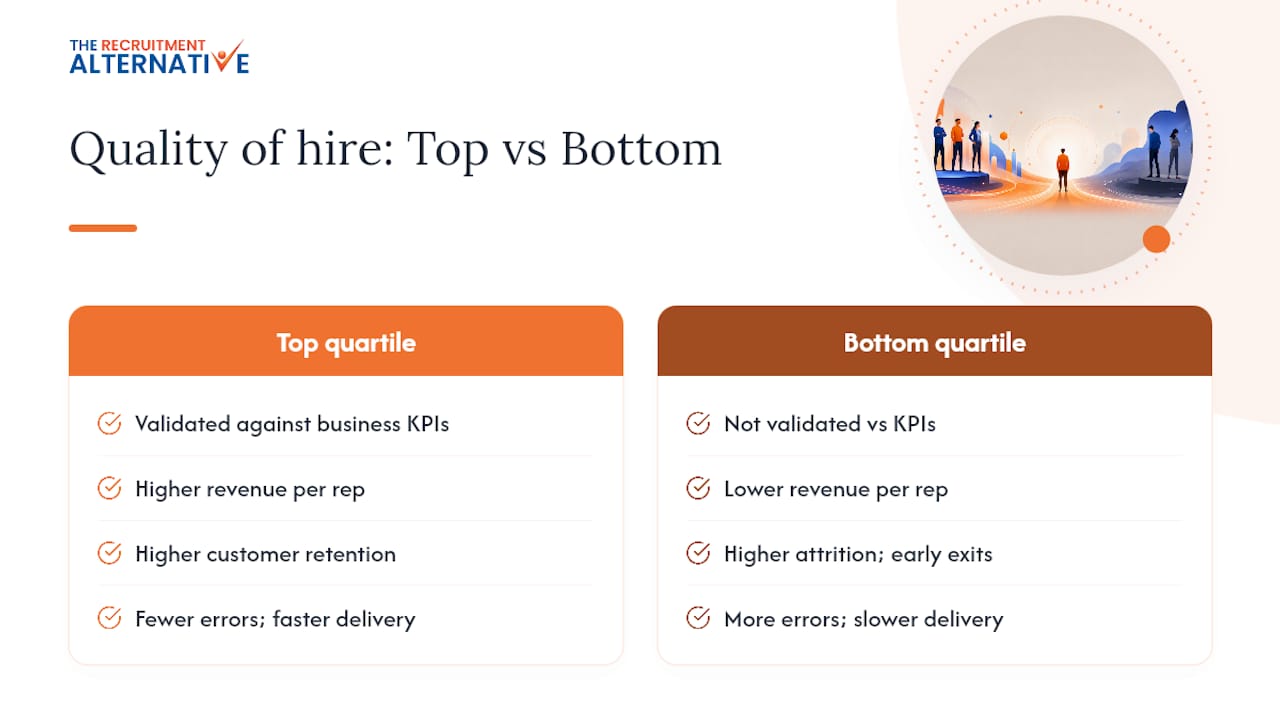
A quality of hire score only earns its place on a leadership dashboard when it connects to something the business already tracks: revenue per rep, customer retention, error rates, project delivery times. Crosschq’s framing is blunt about this: validation against real business KPIs is the step that turns quality of hire from an HR vanity metric into an actual business metric.
The mechanics are straightforward once you have a year or two of scorecard data. Pull your top-quartile quality of hire scorers and compare their business-metric performance against your bottom quartile. If your highest scorers are also your strongest revenue producers or your lowest-attrition group, you have a defensible case that the scorecard is measuring something real, not just a proxy for how much people like the new hire.
That link is also where recruitment ROI calculations get sharper. Cost-per-hire tells you what you spent. Quality of hire, once validated against business outcomes, tells you what you got for it. A cheaper hire who scores poorly and leaves within a year costs the business far more than the recruiting fee ever suggested, once you factor in lost productivity, rehiring costs and the true cost of a bad hire against a slower, more expensive process that produces a strong performer. Quality of hire is the number that makes that trade-off visible instead of invisible.
Best practices for communicating quality of hire results to leadership
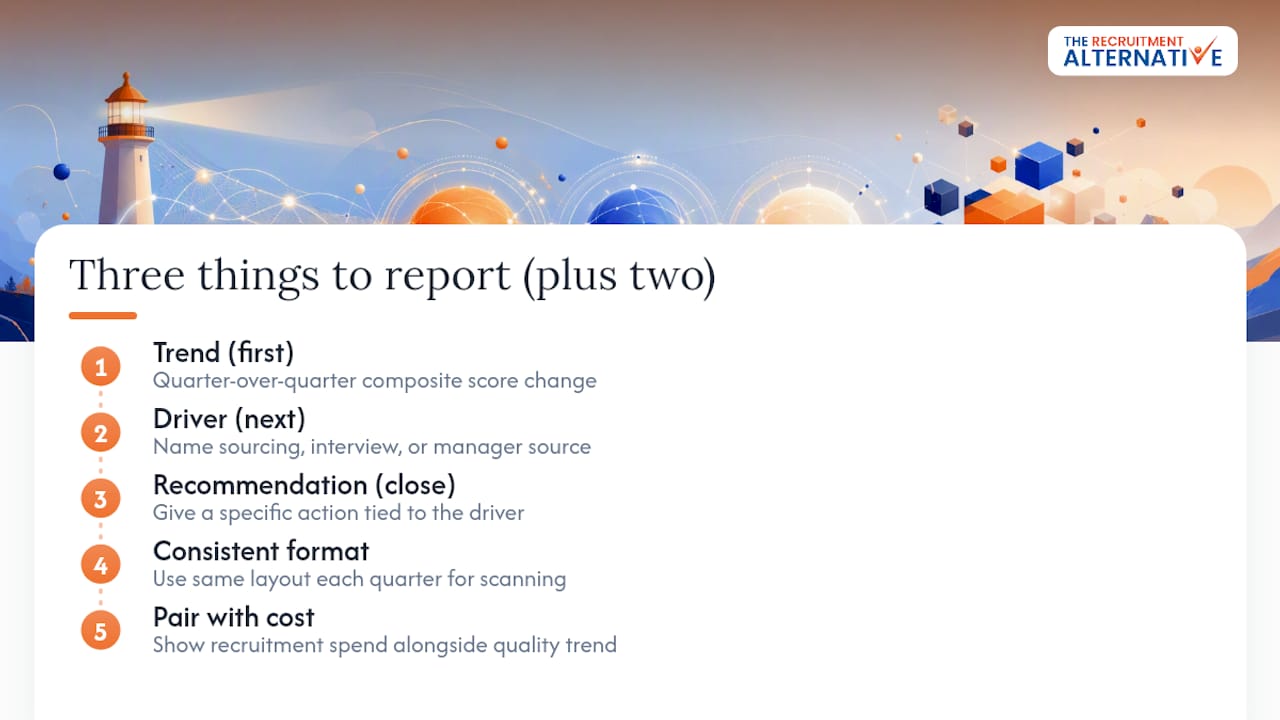
Leadership does not want a spreadsheet of normalised scores. They want to know whether hiring is getting better or worse, and what to do about it. Translate the scorecard into three things every time you report: the trend, the driver, and the recommendation.
Show the trend first, quarter over quarter, not a single point-in-time number. A composite score of 74 means nothing on its own; a score that has climbed from 68 to 74 over three quarters tells a story leadership can act on. Identify the driver next: is the improvement coming from a stronger sourcing mix, better interview structure, or a specific hiring manager’s team consistently landing strong performers? Naming the driver is what turns the report from a scorecard into a decision-making tool.
Close every report with a specific recommendation, not just data. If referral hires are scoring 15 points higher than job-board hires, the recommendation is to shift budget toward the referral program, not to note the gap and move on. Keep the format consistent across quarters so leadership can scan a trend line at a glance rather than relearning a new layout every time. And avoid presenting the score in isolation from cost: pairing quality of hire trends with recruitment spend in the same report is what earns this metric a permanent seat at the budget table rather than a one-off mention in an annual review.
Case studies or real-world examples demonstrating impact of quality of hire measurement
The organisations that get the most value from quality of hire measurement are rarely the ones with the fanciest dashboards. They are the ones that used the data to change one specific decision.
A common pattern shows up when companies finally segment their scores by source, exactly the diagnostic use case SHRM highlights as essential to making quality of hire actionable. A business tracking composite scores across its sourcing channels typically finds referral and internal mobility hires scoring meaningfully ahead of job-board hires, in line with the pattern Taleva’s benchmarking data shows across the broader market. Acting on that gap by reallocating sourcing budget toward referral incentives is a low-risk, high-leverage move that the data justifies clearly.
Another common pattern involves hiring manager calibration. When teams introduce structured, standardised satisfaction surveys instead of ad hoc feedback, the variance between managers narrows sharply. This does not just tidy the data. It usually reveals that one or two hiring managers have been running weak interview processes all along, hidden inside noisy, inconsistent ratings. Once that is visible, targeted interview training becomes an obvious next step rather than a guess.
The lesson across every version of this pattern is the same: quality of hire measurement pays off fastest when it is tied to one clear action, not left as a passive report nobody reads.
A recruiter’s take on what actually moves the needle
Every quality of hire program lives or dies on one thing: whether structured interview scorecards get used consistently, not on how sophisticated the maths behind the composite score is. If you take one thing from this guide into your next hiring round, make it that. Start there this week, before you touch a spreadsheet formula.
— Josh Townsend
How The Recruitment Alternative helps you put this into practice
Measuring quality of hire only pays off if the hires themselves are strong to begin with, and that is where a fixed-fee model changes the maths. The Recruitment Alternative charges a transparent, upfront fee rather than a percentage of salary, so the cost of filling a role does not creep up as you target more senior or higher-paid hires.
That predictability matters when you are building a quality of hire scorecard, because it lets you compare recruiting spend against outcome scores on a level playing field, role to role, without a commission structure skewing the numbers. The Recruit and Recruit+ fixed-fee options cover a broad range of industries, from sales and administration through to engineering, healthcare and technology, with a replacement guarantee if a placement does not work out in the first few months. If you are ready to pilot a quality of hire scorecard against your next hiring round, consider contacting a fixed-fee recruitment service to talk through your role and hiring plan.
Sources
- Workable — Quality of hire tutorial
- Intervue — Quality of hire calculator
- Taleva — Quality of hire: how to measure and benchmark
FAQ
What are the 5 key HR metrics for measuring hiring success?
The five most commonly tracked are quality of hire, time-to-fill, cost-per-hire, retention rate and hiring manager satisfaction. Quality of hire is the only one of the five that directly measures post-hire performance rather than process efficiency, which is why it needs its own composite scoring approach rather than a single number pulled from the ATS.
Is there a formula for calculating quality of hire?
Yes. The most widely used approach normalises indicators such as performance score, ramp speed, hiring manager satisfaction and retention onto a 0 to 100 scale and averages them into one composite figure per hire. Weighting can be adjusted depending on which indicators matter most for a given role.
What are the 10 most desired qualities of a new hire?
There is no single, universally agreed list of ten, since desired qualities vary by role and industry, but recurring themes across hiring guides include reliability, communication, adaptability, problem-solving, cultural fit, initiative, coachability, technical competence, collaboration and resilience under pressure. Structured interviews and standardised scorecards help assess these consistently rather than relying on gut feel.
What are the KPIs for recruitment?
Core recruitment KPIs include time-to-fill, cost-per-hire, source yield, offer-acceptance rate and quality of hire, with the last one requiring post-hire data rather than data available at the point of placement. Tracking these metrics together gives a fuller picture of whether a recruitment process is fast, affordable and actually producing strong hires.
How much does The Recruitment Alternative charge to fill a role?
The Recruitment Alternative’s fixed-fee recruitment service is listed at $4,795 one-off on its main pricing page, with tiered Recruit and Recruit+ options detailed on its flat-fee structure page depending on the role and salary level. This fixed-cost structure makes it easier to compare recruiting spend against quality of hire outcomes without commission percentages distorting the comparison.

