

The job offer acceptance rate (OAR) is the percentage of formal job offers that candidates accept, calculated as: (offers accepted ÷ offers extended) × 100. As the clearest single signal of how competitive your offers and process are, a healthy OAR typically sits above a certain high threshold for most Australian roles, though this varies by industry and seniority. Your most useful next step is to pull your recent offer data, segment it by role family and source, and compute OAR for each group before drawing any conclusions from a blended figure.
Key takeaways
The job offer acceptance rate is the single most direct measure of how well your offers and process convert final-stage candidates into hires, and improving it starts with segmenting your data before drawing any conclusions from a blended figure.
| Point | Details |
|---|---|
| OAR formula | Divide offers accepted by offers extended, multiply by 100; measure on a rolling 90-day window. |
| Benchmark guidance | Healthy OAR ranges from — for mid-level roles; executive roles typically sit between —. |
| Diagnose before fixing | Distinguish process-driven declines (slow offers, poor engagement) from market-driven ones before adjusting compensation. |
| Highest-impact tactic | Reduce time-to-offer to under five business days; this single change addresses the most common decline cause. |
| The Recruitment Alternative | Flat-fee recruitment with early compensation transparency and structured candidate engagement helps Australian employers lift OAR without increasing cost-per-hire. |
Table of Contents
- What does the job offer acceptance rate actually measure?
- Why a low OAR costs you more than you might expect
- How to calculate your OAR correctly
- Worked example: from raw data to a dashboard figure
- What counts as a good acceptance rate in Australia?
- How to diagnose why your OAR is falling
- Practical tactics to raise your offer acceptance rate
- How to include OAR in your recruitment dashboards
- Other recruitment metrics to track alongside OAR
- Building a consistent measurement policy across your team
- Simple templates and formulas for your dashboard
- The OAR metric most teams are reading wrong
- Faster offers, lower cost: how The Recruitment Alternative addresses OAR
- Sources
What does the job offer acceptance rate actually measure?
OAR counts one specific event: a formal written offer extended to a final-stage candidate, and whether that candidate accepted it. It does not measure application rates, interview conversion, or candidate interest at earlier funnel stages. The population is strictly those candidates who received a documented offer.
Talent acquisition leaders use OAR to gauge offer competitiveness and process quality. Hiring managers use it to understand their team’s attractiveness to candidates. Finance and workforce planning teams use it to forecast headcount delivery, since a lower OAR means more offers per hire and longer time-to-fill.
A blended OAR hides the variation that actually matters. Segmenting OAR by source, role family, and seniority is what turns a vanity metric into a diagnostic tool.
Common counting edge cases to agree on before you start measuring:
- Withdrawals before acceptance: Count the offer as extended but not accepted. Do not exclude it.
- Contingent offers (subject to reference or medical checks): Count as extended at the point of issue; update to accepted only when conditions are met and the candidate confirms.
- Multiple offers to the same candidate (e.g. after negotiation): Count as one offer event, not two.
- Rescinded offers: Remove from both numerator and denominator; a rescinded offer is not a decline.
- Internal transfers: Exclude unless your organisation formally tracks internal mobility as a separate OAR stream.
Why a low OAR costs you more than you might expect
Every declined offer adds cost and delay. When a candidate declines, the recruiter typically returns to the shortlist, re-engages a second-preference candidate, and extends a new offer, sometimes weeks later. That cycle inflates cost-per-hire, delays project delivery, and consumes recruiter capacity that could be spent on new requisitions.
The maths is straightforward. Across 50 hires a year, that gap is material.
There is also a reputational dimension. Candidates who decline often share their experience, and repeated declines from the same employer can signal to the market that offers are uncompetitive or that the process is slow and disorganised. For roles where your talent pool is small, such as specialist engineering or senior technology positions, that signal travels quickly. Recruitment process improvement at the offer stage is one of the highest-return investments a TA team can make.
How to calculate your OAR correctly
The formula is:
OAR (%) = (Number of offers accepted ÷ Number of offers extended) × 100
This is the canonical formula used across TA metric frameworks, including NACE guidance on offer-to-acceptance rates.
Counting rules checklist:
- Record each offer at the point a formal written offer is issued, not at verbal offer stage.
- Use unique offer events, not unique candidates (one candidate, one offer = one event).
- Exclude rescinded offers from both numerator and denominator.
- Include declined offers in the denominator even if the candidate later reapplied.
- For contingent offers, record acceptance only when all conditions are satisfied and confirmed in writing.
- Agree on a cut-off date: count acceptance within a defined response window (typically 5–7 business days) to avoid open-ended tracking.
Measurement windows:
- Rolling 30 days: Best for high-volume hiring teams needing a fast feedback loop.
- Rolling 90 days: The standard for most TA teams; large enough to be statistically meaningful, short enough to catch trend shifts.
- Rolling 365 days: Useful for annual reporting and benchmarking against prior years.
Pro Tip: When a candidate negotiates and you issue a revised offer, treat the revised offer as the same offer event. Only record a new event if the original offer was formally declined and a new role or package was offered from scratch. This prevents inflating your denominator and understating your true OAR.
Worked example: from raw data to a dashboard figure
Simple example
Your team extended 45 offers in the last 90 days. Of those, 39 candidates accepted.
That is a solid result for most Australian role types, though context matters.
Segmented example
The same 45 offers break down differently by source:
That is where recruiter attention and process review should go, not across the board. Large-sample analysis confirms that referrals can convert 15–25 percentage points higher than inbound applicants, so this pattern is common, not a fluke.
What counts as a good acceptance rate in Australia?
There is no single universal benchmark, and any source claiming one should be read with caution. That said, practical guidance and international data give useful reference points.
European benchmarks report an average OAR of 88% across industries, with meaningful variation by country, sector, and seniority. Australian market dynamics are broadly comparable in pattern, though local labour market conditions, particularly in healthcare, technology, and construction, can push rates lower for specialist roles.
These ranges reflect the general pattern: the more senior or specialised the role, the more candidates are likely to be fielding competing offers, and the more negotiation is expected. US Glassdoor data found roughly 17.3% of job offers were rejected, implying an acceptance rate near 83%, which aligns with the mid-level professional range above.
Target-setting checklist:
- Segment your historical OAR by role family, seniority, and source before setting any target.
- Choose a 90-day rolling window as your primary horizon for operational targets.
- Set a realistic target based on your historical average plus a 3–5 percentage point improvement goal.
- Define a minimum acceptable rate below which a formal review is triggered.
- Review targets quarterly and adjust for market conditions, particularly in tight talent segments.
How to diagnose why your OAR is falling
Not all OAR declines have the same cause, and the fix depends entirely on which type you are dealing with. Practitioners distinguish two primary decline types: process-driven and market-driven.
Process-driven declines occur when your own hiring workflow is creating friction or uncertainty. Signals include: offers taking more than five business days after the final interview, candidates citing confusion about the role or package, or hiring managers who are not actively selling the opportunity during the interview process.
Market-driven declines occur when external competition is the primary cause. Signals include: candidates citing a competing offer as the reason for declining, salary benchmarks that have shifted since your last compensation review, or a cluster of declines concentrated in one role type during a period of low unemployment.
Speed from final interview to formal offer is one of the highest-leverage diagnostics available. Even a delay of two or three business days materially increases the probability that a candidate accepts another offer in the interim. If your time-to-offer exceeds five business days, that is the first process variable to fix before adjusting compensation.
Diagnostic signal checklist:
- Time-to-offer: is it more than five business days from final interview to written offer?
- Compensation transparency: did candidates receive a salary range before or during the interview?
- Hiring manager conviction: are hiring managers actively communicating enthusiasm post-interview?
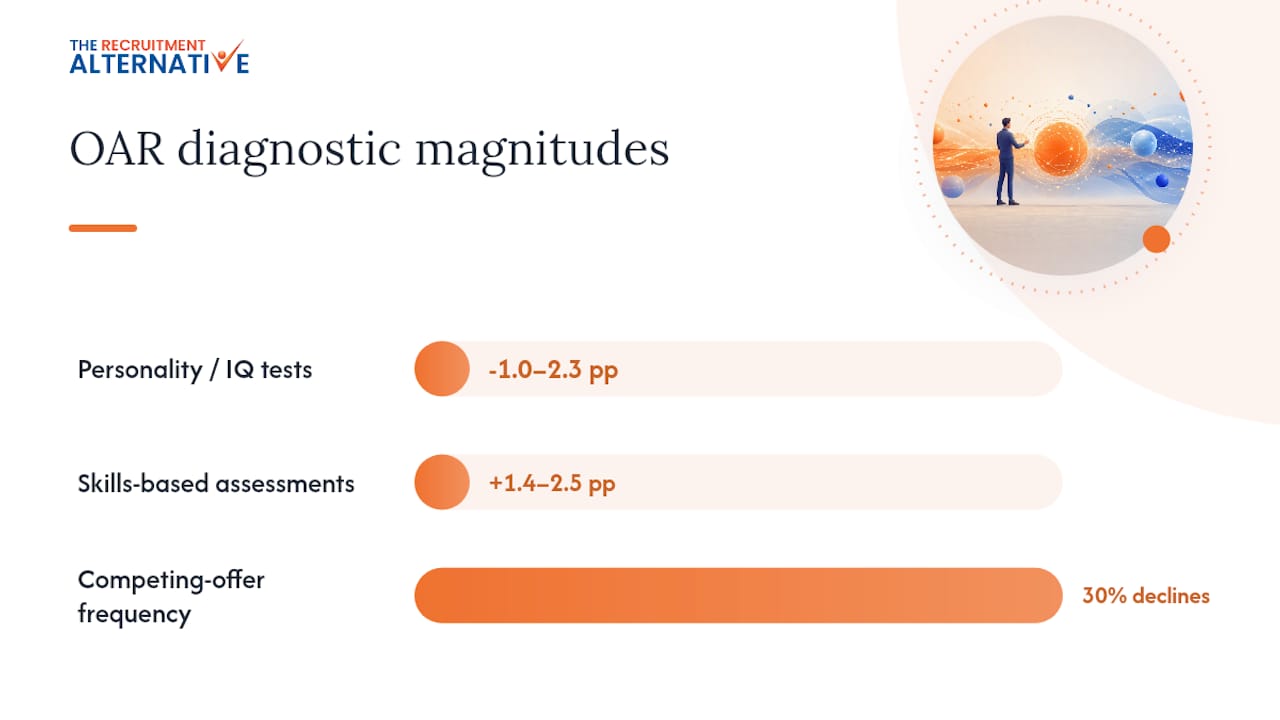
- Competing offer frequency: are more than 30% of declines citing another offer as the reason?
- Interview design: are you using personality or IQ tests that may be reducing acceptance? Glassdoor research found personality and IQ tests can reduce acceptance rates by 1.0–2.3 percentage points, while skills-based assessments can increase them by 1.4–2.5 percentage points.
Pro Tip: Run a short exit survey for every declined offer. Ask one open question: “What was the primary reason you chose not to accept?” Three months of responses will tell you whether you have a process problem, a compensation problem, or a market problem, and that distinction determines where to spend your effort.
Practical tactics to raise your offer acceptance rate
Ranked by likely impact and ease of implementation for Australian hiring teams:
-
Reduce time-to-offer. Set an internal SLA of three business days from final interview to written offer. Assign a named owner for each step in the approval chain. This single change addresses the most common process-driven decline. For technical roles, reducing IT recruiter placement time through pre-approved offer templates and delegated approval authority can cut days off the cycle.
-
Share salary ranges before the interview. Candidates who reach the offer stage without knowing the compensation range are more likely to decline when the number does not meet expectations. Publishing ranges in the job ad or sharing them at the first screening call removes a major source of late-stage friction.
-
Coach hiring managers to close. The hiring manager’s post-interview communication is often the deciding factor for candidates weighing two similar offers. A personal call or message within 24 hours of the final interview, expressing genuine enthusiasm, shifts the emotional calculus in your favour. Culture-fit hiring conversations during the interview also give candidates a stronger sense of belonging before the offer arrives.
-
Personalise the offer package. A one-size-fits-all offer letter is a missed opportunity. Where possible, tailor the package to what the candidate signalled during the process: flexible working arrangements, professional development support, or an earlier start date. These adjustments often cost little but signal that you were listening.
-
Prepare a counter-offer strategy. For senior and specialist roles, assume the candidate will receive a counter-offer from their current employer. Brief the hiring manager in advance on the likely counter and agree on the maximum flexibility available. A recruiter who can respond to a counter-offer within hours rather than days retains far more candidates.
-
Strengthen your referral programme. Referrals consistently convert at the highest OAR of any source, often 15–25 percentage points above inbound applicants. Increasing referral volume through structured incentives is one of the fastest ways to lift a blended OAR without changing your compensation structure.
Pro Tip: For roles where job boards are underperforming, shift sourcing budget toward direct outreach and referrals rather than increasing job board spend. A higher-quality candidate entering the funnel is more likely to accept an offer at the end of it.
How to include OAR in your recruitment dashboards
OAR is most useful when it sits alongside the metrics that explain it. A minimum dashboard for a TA team should include:
- OAR by segment (role family, seniority, source, hiring manager, geography)
- Time-to-offer (days from final interview to written offer)
- Time-to-hire (days from requisition open to accepted offer)
- Offers per hire (total offers extended divided by accepted offers; the inverse of OAR)
- Offer-to-start fall-off (candidates who accepted but did not start)
- Withdrawal rate (candidates who withdrew before an offer was extended)
Reporting cadence and audience:
- Weekly recruiter view: OAR by open requisition, time-to-offer flag for any offer outstanding more than three business days.
- Monthly TA leader view: OAR by segment, trend line, comparison to prior period, and any segment below the minimum acceptable threshold.
- Quarterly executive summary: OAR linked to cost-per-hire and headcount delivery rate. Show the relationship between offers per hire, recruiter cost, and total hiring expenditure.
Linking OAR to financial outcomes is what gets executive attention. If your team extended 120 offers to make 90 hires last quarter, your offers-per-hire ratio was 1.33. At an average recruiter cost of $1,500 per offer processed, that is $45,000 in offer-stage cost to deliver 90 hires.
Other recruitment metrics to track alongside OAR
OAR does not operate in isolation. Each of the following metrics either explains a movement in OAR or is explained by it.
Offers per hire is the direct inverse of OAR. Track this to quantify the recruiter workload cost of a low OAR.
Time-to-offer measures days from final interview to written offer. A rising time-to-offer almost always precedes a falling OAR, making it the most useful leading indicator in the set.
Time-to-hire covers the full cycle from requisition to accepted offer. OAR affects this directly: every declined offer adds days to the average.
Offer-to-start fall-off tracks candidates who accepted but did not show up on day one. A high OAR paired with a high fall-off rate signals a problem in the post-acceptance experience. Strong onboarding practices reduce this gap considerably.
Withdrawal rate counts candidates who exit the process before an offer is made. A rising withdrawal rate often signals that a competitor is moving faster, or that your process has too many stages.
Source conversion rate measures how each sourcing channel converts from application to accepted offer. When this drops for a specific channel, it often shows up in OAR before the cause is obvious.
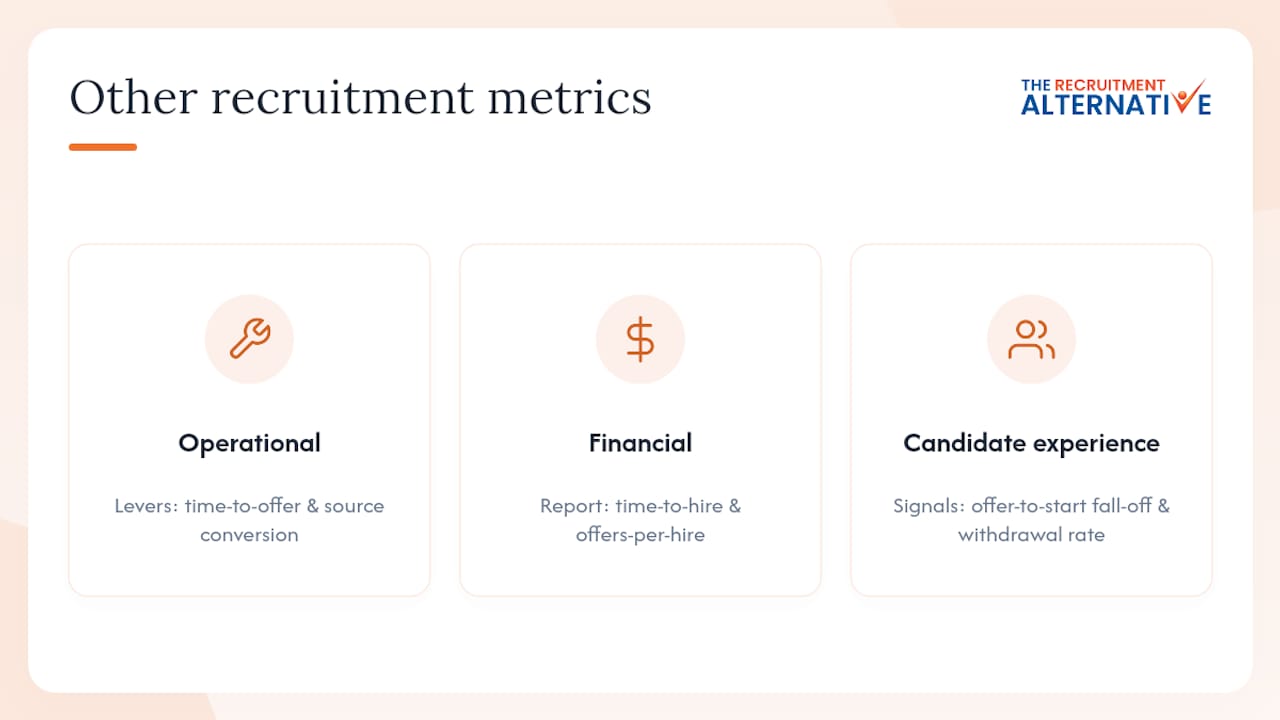
Act on time-to-offer and source conversion rate as operational levers. Treat time-to-hire and offers-per-hire as financial reporting metrics. Offer-to-start fall-off and withdrawal rate are candidate experience signals that warrant a separate diagnostic.
Building a consistent measurement policy across your team
Without a shared measurement policy, OAR figures from different recruiters or business units are not comparable. The following numbered policy template gives TA leaders a starting point.
- Define the offer event: A formal offer is a written document (email or letter) containing role title, salary, start date, and employment conditions, issued to a named candidate.
- Assign data ownership: The recruiter managing the requisition records the offer event in the ATS at the point of issue. The TA operations lead or HRIS administrator signs off on monthly data exports.
- Set the response window: Acceptance must be recorded within seven calendar days of offer issue. Offers with no response after seven days are recorded as declined.
- Agree on exclusions: Internal transfers, rehires within 30 days of separation, and offers rescinded by the employer are excluded from OAR calculations.
- Handle contingent offers consistently: Record as extended at issue; update to accepted only when all conditions (references, medical, background check) are satisfied in writing.
- Back-fill and correction policy: Historical data may be corrected within the same calendar quarter. Corrections in a prior quarter require TA leader approval and a note in the audit log.
- Review the policy annually: Align with any ATS or HRIS system changes that affect how offers are recorded.
Applying this policy consistently across teams is what makes trend data meaningful.
Simple templates and formulas for your dashboard
Getting OAR into a spreadsheet takes minutes once the counting rules are agreed.
Excel / Google Sheets formulas:
- OAR:
=B2/A2*100where A2 = offers extended, B2 = offers accepted. Format the cell as a percentage. - Offers per hire:
=A2/B2where A2 = offers extended, B2 = accepted offers. - Rolling 90-day OAR: Use
SUMIFSto sum accepted and extended offers within a date range:=SUMIFS(accepted_col, date_col, ">="&TODAY()-90, date_col, "<="&TODAY())/SUMIFS(extended_col, date_col, ">="&TODAY()-90, date_col, "<="&TODAY())*100
Suggested dashboard widget columns:
- Segment (role family / source / hiring manager)
- Offers extended (period)
- Offers accepted (period)
- OAR % (calculated)
- Prior period OAR % (for trend)
- Time-to-offer average (days)
- Flag (RAG status: green above target, amber within 5 points, red below minimum)
Visual tips for trend monitoring:
- Plot OAR as a line chart with a shaded band showing your target range and minimum acceptable rate.
- Add a secondary axis for time-to-offer to show the leading-indicator relationship visually.
- Use conditional formatting in the segment table to flag any row below the minimum acceptable threshold in red.
Pro Tip: Set control limits on your OAR chart (mean ± 1.5 standard deviations across the last 12 months). A data point outside the control limits signals a genuine shift in performance, not random variation, and warrants a formal review.
The OAR metric most teams are reading wrong
There is a persistent assumption in hiring teams that a falling OAR is primarily a compensation problem. In practice, that is rarely the first thing to fix.
Most OAR declines I see in Australian organisations trace back to process friction: offers that take too long, hiring managers who go quiet after the final interview, or candidates who reach the offer stage without a clear picture of the total package. These are fixable without touching the salary budget. The SocialTalent guidance on time-to-offer is correct on this point: speed is the highest-leverage variable, and it costs nothing to improve.
The second misconception is that a high OAR is always a good sign. That looks efficient until you realise you are missing strong candidates who dropped out earlier because the process was too demanding. OAR is a diagnostic, not a score to maximise in isolation.
The third pattern worth naming is the counter-offer problem at senior levels. Australian employers often lose candidates at the offer stage not because the package is wrong, but because the hiring manager did not build enough conviction during the interview process. The fix is not a higher salary; it is a better interview experience that builds genuine enthusiasm for the new role. Partnering with a trusted recruitment agency that manages candidate engagement through the entire process, not just sourcing, makes a measurable difference here.
Faster offers, lower cost: how The Recruitment Alternative addresses OAR
The most common OAR failure modes, slow offers, poor candidate communication, and late-stage compensation surprises, are all process problems. The Recruitment Alternative’s flat-fee recruitment model is built to address exactly these gaps.
Because the fee is fixed rather than percentage-based, there is no incentive to slow the process or inflate the package. Candidates are briefed on compensation expectations early, offers move quickly through a streamlined approval process, and hiring managers are coached on post-interview engagement as part of the service. For businesses that have struggled with high offer decline rates, particularly in competitive sectors like technology, healthcare, and engineering, this structure removes the friction points that typically drive declines. The simple flat-fee pricing also means you know your cost per hire before you start, which makes headcount forecasting considerably more reliable. To see how the model works for your next hire, get in touch with The Recruitment Alternative today.
Sources
- Offer acceptance rate: Hiring glossary – Join
- Why Do Candidates Reject Job Offers? (Glassdoor report)
- Offer Acceptance Rate Benchmarks: What 1.9M Candidate Responses Reveal About Your Closing Stage

